This guide describes how and why to use the Google Sheets API to create pivot tables in your spreadsheets.
What is a pivot table?
Pivot tables provide a way to summarize data in your spreadsheet, automatically aggregating, sorting, counting, or averaging the data while displaying the summarized results in a new table. A pivot table acts as a sort of query against a source data set. This source data exists at some other location in the spreadsheet, and the pivot table presents a processed view of the data.
For example, consider the following sales data set:
| A | B | C | D | E | F | G | |
| 1 | Item Category | Model Number | Cost | Quantity | Region | Salesperson | Ship Date |
| 2 | Wheel | W-24 | $20.50 | 4 | West | Beth | 3/1/2016 |
| 3 | Door | D-01X | $15.00 | 2 | South | Amir | 3/15/2016 |
| 4 | Engine | ENG-0134 | $100.00 | 1 | North | Carmen | 3/20/2016 |
| 5 | Frame | FR-0B1 | $34.00 | 8 | East | Hannah | 3/12/2016 |
| 6 | Panel | P-034 | $6.00 | 4 | North | Devyn | 4/2/2016 |
| 7 | Panel | P-052 | $11.50 | 7 | East | Erik | 5/16/2016 |
| 8 | Wheel | W-24 | $20.50 | 11 | South | Sheldon | 4/30/2016 |
| 9 | Engine | ENG-0161 | $330.00 | 2 | North | Jessie | 7/2/2016 |
| 10 | Door | D-01Y | $29.00 | 6 | West | Armando | 3/13/2016 |
| 11 | Frame | FR-0B1 | $34.00 | 9 | South | Yuliana | 2/27/2016 |
| 12 | Panel | P-102 | $3.00 | 15 | West | Carmen | 4/18/2016 |
| 13 | Panel | P-105 | $8.25 | 13 | West | Jessie | 6/20/2016 |
| 14 | Engine | ENG-0211 | $283.00 | 1 | North | Amir | 6/21/2016 |
| 15 | Door | D-01X | $15.00 | 2 | West | Armando | 7/3/2016 |
| 16 | Frame | FR-0B1 | $34.00 | 6 | South | Carmen | 7/15/2016 |
| 17 | Wheel | W-25 | $20.00 | 8 | South | Hannah | 5/2/2016 |
| 18 | Wheel | W-11 | $29.00 | 13 | East | Erik | 5/19/2016 |
| 19 | Door | D-05 | $17.70 | 7 | West | Beth | 6/28/2016 |
| 20 | Frame | FR-0B1 | $34.00 | 8 | North | Sheldon | 3/30/2016 |
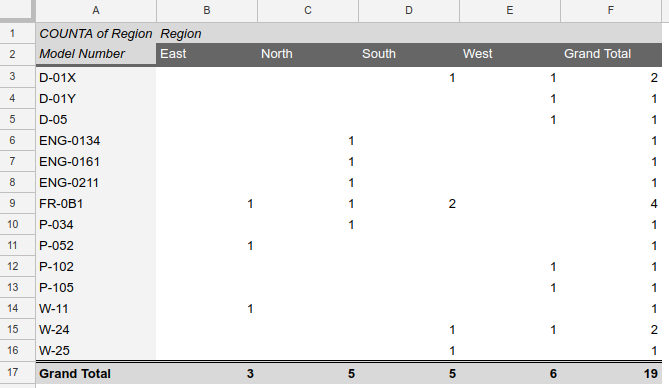
You could use a pivot table to create a report showing how many of each model number were sold in each region:

For the source code used to generate this pivot table, see the Example section below.
Once a pivot table is placed in a spreadsheet, users can interactively change the summary's structure and details using the Sheets UI.
Working with pivot tables
A pivot table definition is associated with a single cell on a sheet. Although its rendered appearance is many cells in both height and width, programmatically it's located at a single cell coordinate. This cell becomes the top-left corner of the rendered pivot table, with its horizontal and vertical extent determined by its definition.
Adding a pivot table
To add a pivot table, use the batchUpdate method, supplying an updateCells request. You use this request to supply a PivotTable definition as the content of a cell as shown below:
"updateCells": {
  "rows": {
    "values": [{
      "pivotTable": MyPivotTable
    },
    "start": {
      "sheetId": sheetId,
      "rowIndex": 0,
      "columnIndex": 0
    },
    "fields": "pivotTable"
  }
This places the pivot table described by MyPivotTable on the specified sheet,
with the top-left corner at cell A1. (The height and width of the pivot
table are dynamic; you specify only the origin.)
The PivotTable type lets you specify:
- Source data range
- One or more fields whose data will form the rows of the pivot table
- One or more fields whose data will form the columns of the pivot table
- Filtering and aggregation criteria
- Pivot table layout
Modifying and deleting pivot tables
There are no explicit requests to modify or delete a pivot table. Instead, use an updateCells request with different cell contents:
- To modify a pivot table, create a modified PivotTable definition and update the cell using it, similar to adding a new pivot table.
- To delete a pivot table, update the cell with empty values. For an example, see the Delete a pivot table sample.
Use cases
There are many different uses for pivot tables, across a broad range of areas including statistical analysis, ERP applications, financial reporting, and others. Classic pivot table use cases include items like:
- Total sales by region and quarter
- Average salary by title and location
- Count of incidents by product and time of day
The number of potential applications of pivot tables is vast, and the ability to generate them programmatically is powerful. You can generate pivot tables that support interactive exploration but are tailored to specific circumstances, for example:
- Explore incident data for the most recent 24-hour period
- View/analyze aggregated data corresponding to the currently selected account
- Examine sales data for territories belonging to the current user
Example
This example creates a pivot table from a data set to produce the "model number by region" report shown in the introduction of this page. For additional examples, see the pivot table sample page.