Tuesday, July 20, 2021
Suppose you open Search Console and find out that your Google Search traffic dropped. What should you do? A drop in organic Search traffic can happen for several reasons, and most of them can be reversed. But it may not be straightforward to understand what exactly happened to your site.
In this post I'll discuss some of the reasons your traffic may have dropped and how to use the Search Console Performance report and Google Trends to start debugging your Search traffic drop.
Main causes for drops in Search traffic
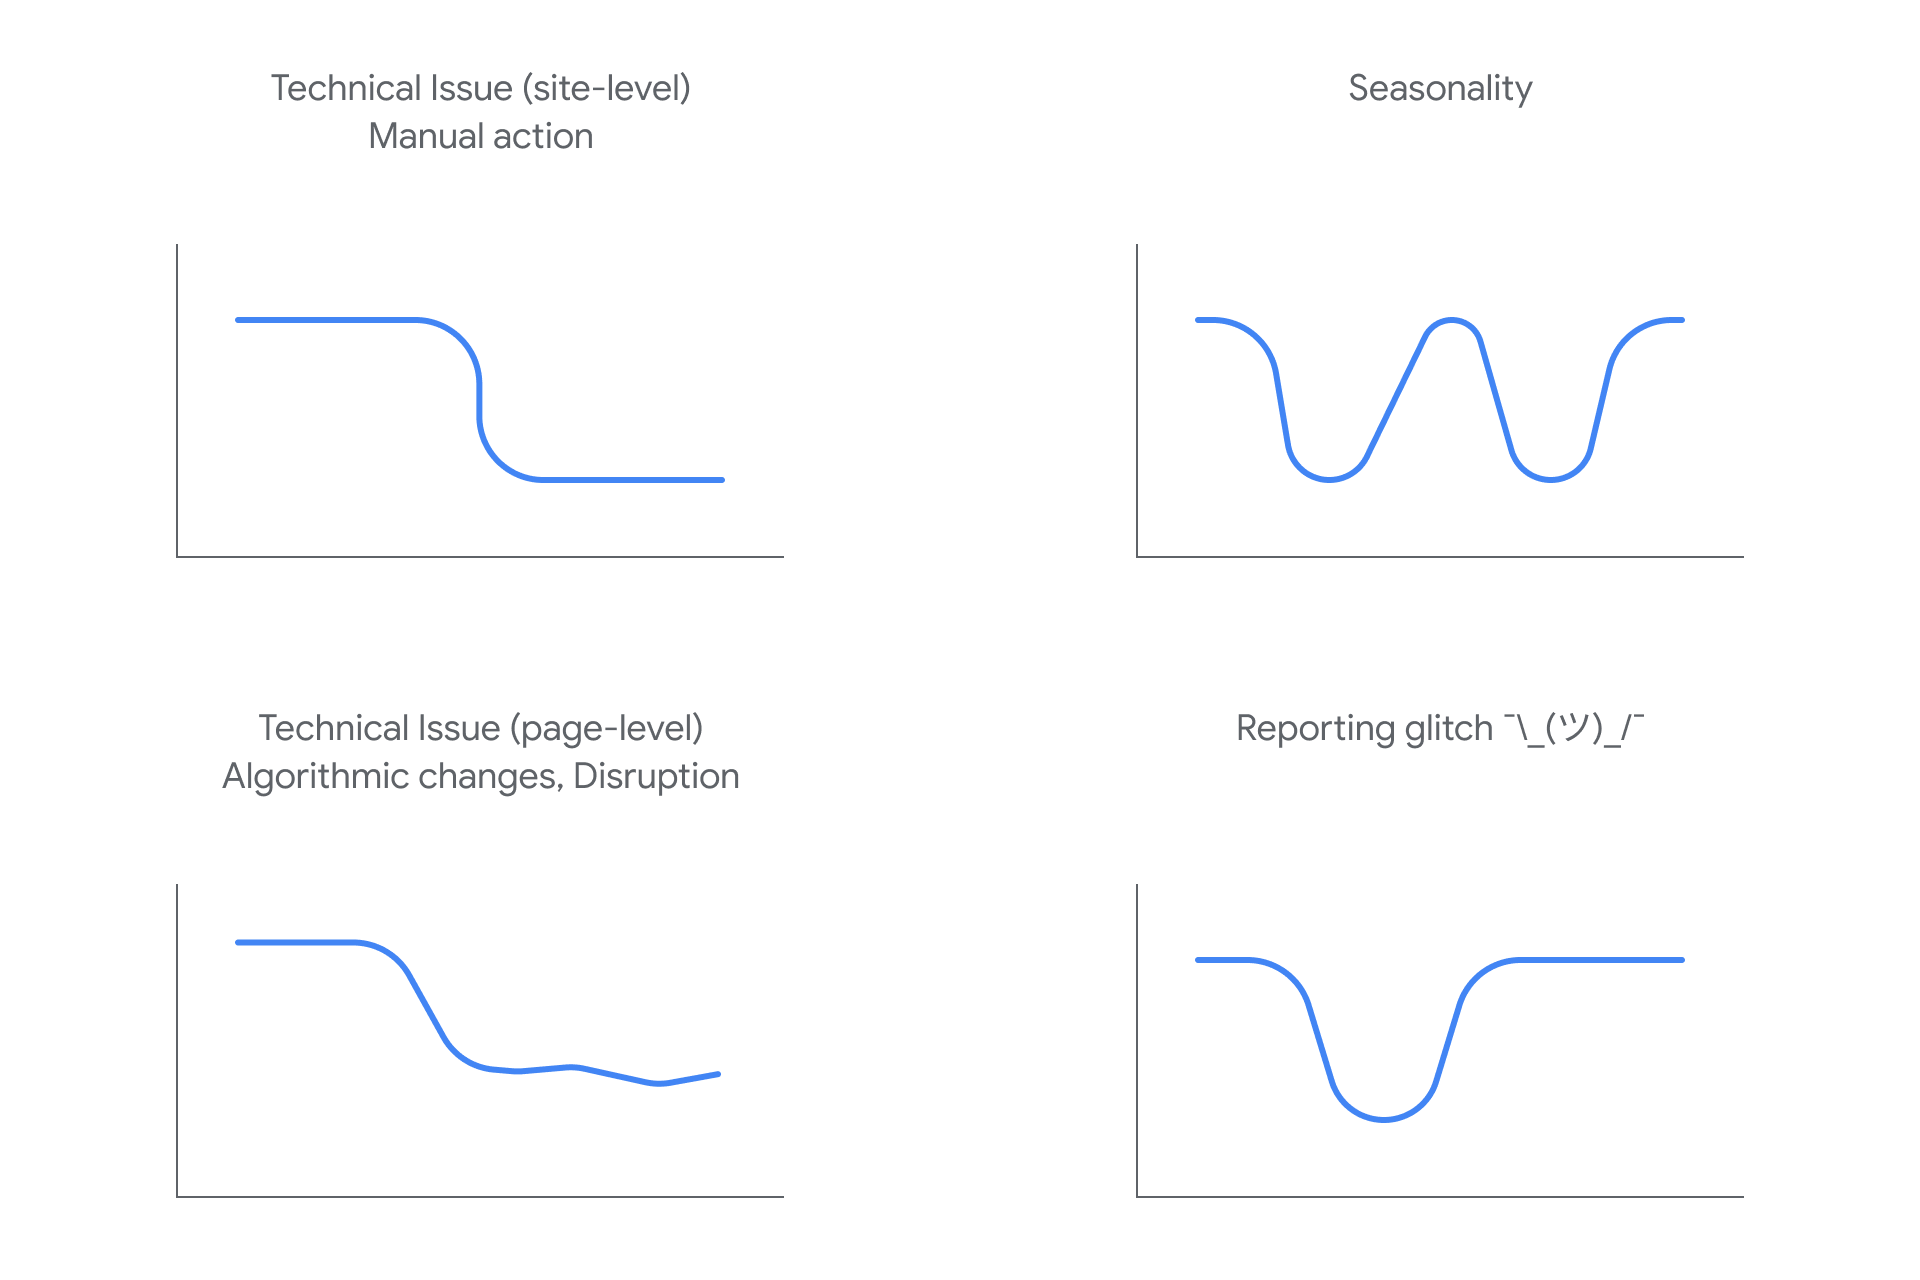
To help you get an idea of what is affecting your traffic, I've sketched a few examples of drops and what they could potentially mean. For more information on each example, read on.

There are five main causes for drops in Search traffic:
- Technical issues: Errors that can prevent Google from crawling, indexing, or serving your pages to users - for example server availability,
robots.txt fetching, page not found, and others. Note that the issues can be site-wide (for example, your website is down) or page-wide (for example,
a misplaced
noindextag, which would depend on Google crawling the page, meaning there would be a slower drop in traffic). - Security issues: If your site is affected by a security threat, Google may alert users before they reach your site with warnings or interstitial pages, which may decrease Search traffic.
- Manual Actions: If your site does not comply with Google's guidelines, some of your pages or the entire site may be omitted from Google Search results through a Manual Action.
- Algorithmic changes: Google is always improving how it assesses content and updating its algorithm accordingly; core updates and other smaller updates may change how some pages perform in Google Search results. To keep track of future updates, subscribe to our Google Search News YouTube series or follow us on Twitter.
- Search interest disruption: Sometimes changes in user behavior will change the demand for certain queries, either as a result of a new trend, or seasonality throughout the year. This means your traffic may drop simply as a result of external influences.
Analyze your Search traffic drop pattern
Since a chart is worth a thousand words, the best way to understand what happened to your traffic is to look at your Search Console Performance report main chart, since it summarizes a lot of information. Analyzing the shape of the line will tell you a lot already.
Visit the Search Performance report and try a few things:
- Change the date range to include 16 months. This will help you analyze the traffic drop in context and make sure it's not a drop that happens every year as a result of a holiday or a trend. If you'd like to extend the 16 month, you could use the Search Analytics API to pull data and store it in your systems.
- Compare the drop period to a similar period. This will help you review what exactly changed. Make sure to click all tabs to find out if the change happened only for specific queries, URLs, countries, devices, or search appearances (learn how to create a comparison filter). Make sure you're comparing the same number of days, preferably the same days of the week.
- Analyze different search types separately. This will help you understand whether the drop you've seen happened in web Search, Google Images, or the Video or News tab.
Here's a Search Console Training video showing how to use the Performance report.
If you find out that there are technical issues, security issues, or manual actions applied to your website, check out the advanced guide to Search Console to learn more about how to solve them.
Investigate overall trends in your industry
If you want to go the extra mile, use Google Trends to help you understand whether the drop is a wider trend or if it's happening just for your site. These changes can be caused by two main factors:
- A search interest disruption or a new product. If there are major changes in what and how people search (for example, a pandemic), people may start searching for different queries, or using their devices for different purposes. In addition, if you sell a specific brand online, there might be a new competing product cannibalizing your search queries.
- Seasonality. For example, the rhythm of food website shows that food related queries are very seasonal: people search for diets in January, turkey in November, and champagne in December. Different industries have different levels of seasonality.
To analyze trends in different industries, you can use Google Trends, which provides access to a largely unfiltered sample of actual search requests made to Google. It's anonymized, categorized, and aggregated. This allows Google to display interest in topics from around the globe or down to city-level.
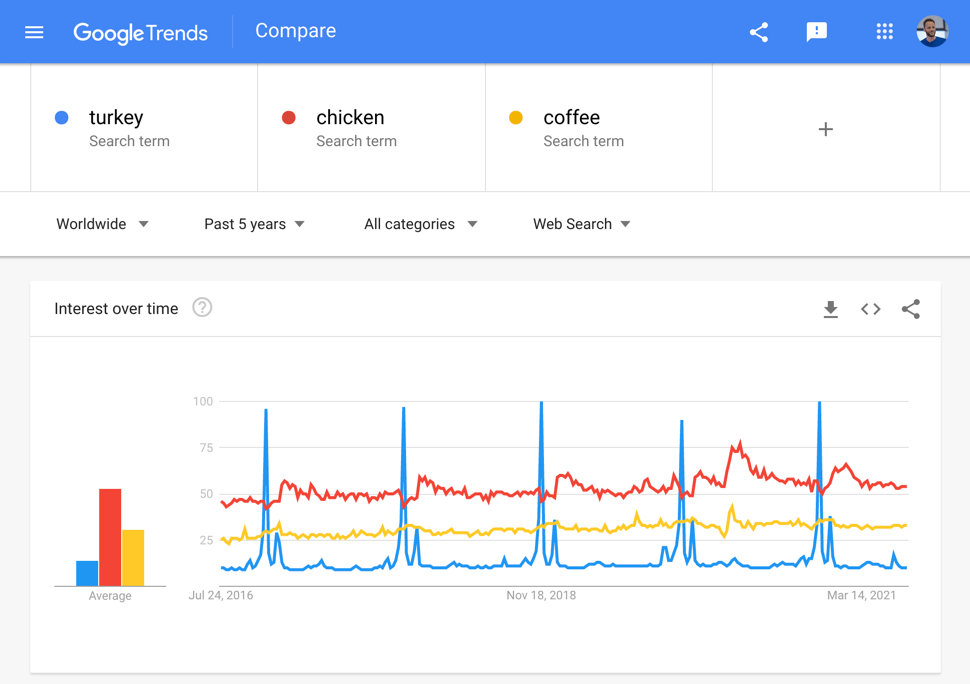
Check the queries that are driving traffic to your website to see if they have clear drops in different times of the year. In the example below, you can see three types of trends (check the data):
- Turkey has a strong seasonality, peaking every year in November.
- Chicken shows some seasonality, but less accentuated.
- Coffee is significantly more stable; it looks like people need it throughout the year.

And since you're already in Google Trends, you may want to check some other interesting insights that might help you with your Search traffic:
- Check top queries in your region and compare them to the queries that you're getting traffic from, as shown in Search Console's Performance report. If there are queries missing from your traffic, check if you have content on that subject and make sure it's being crawled and indexed.
- Check queries that are related to important topics. This might surface rising related queries and help you prepare your site for them, for example by adding related content.
If you have any questions, you can ask in the Search Central community or on Twitter.
